IPL 2022 Result Simulation
This was a weekend project to know the likelihood of a specific IPL team reaching playoffs. IPL is Indian Premier League. A yearly T20 cricket tournament with 10 teams playing in a round-robin format. Some teams play each other twice. 4 teams qualify for playoffs based on the points.
UI
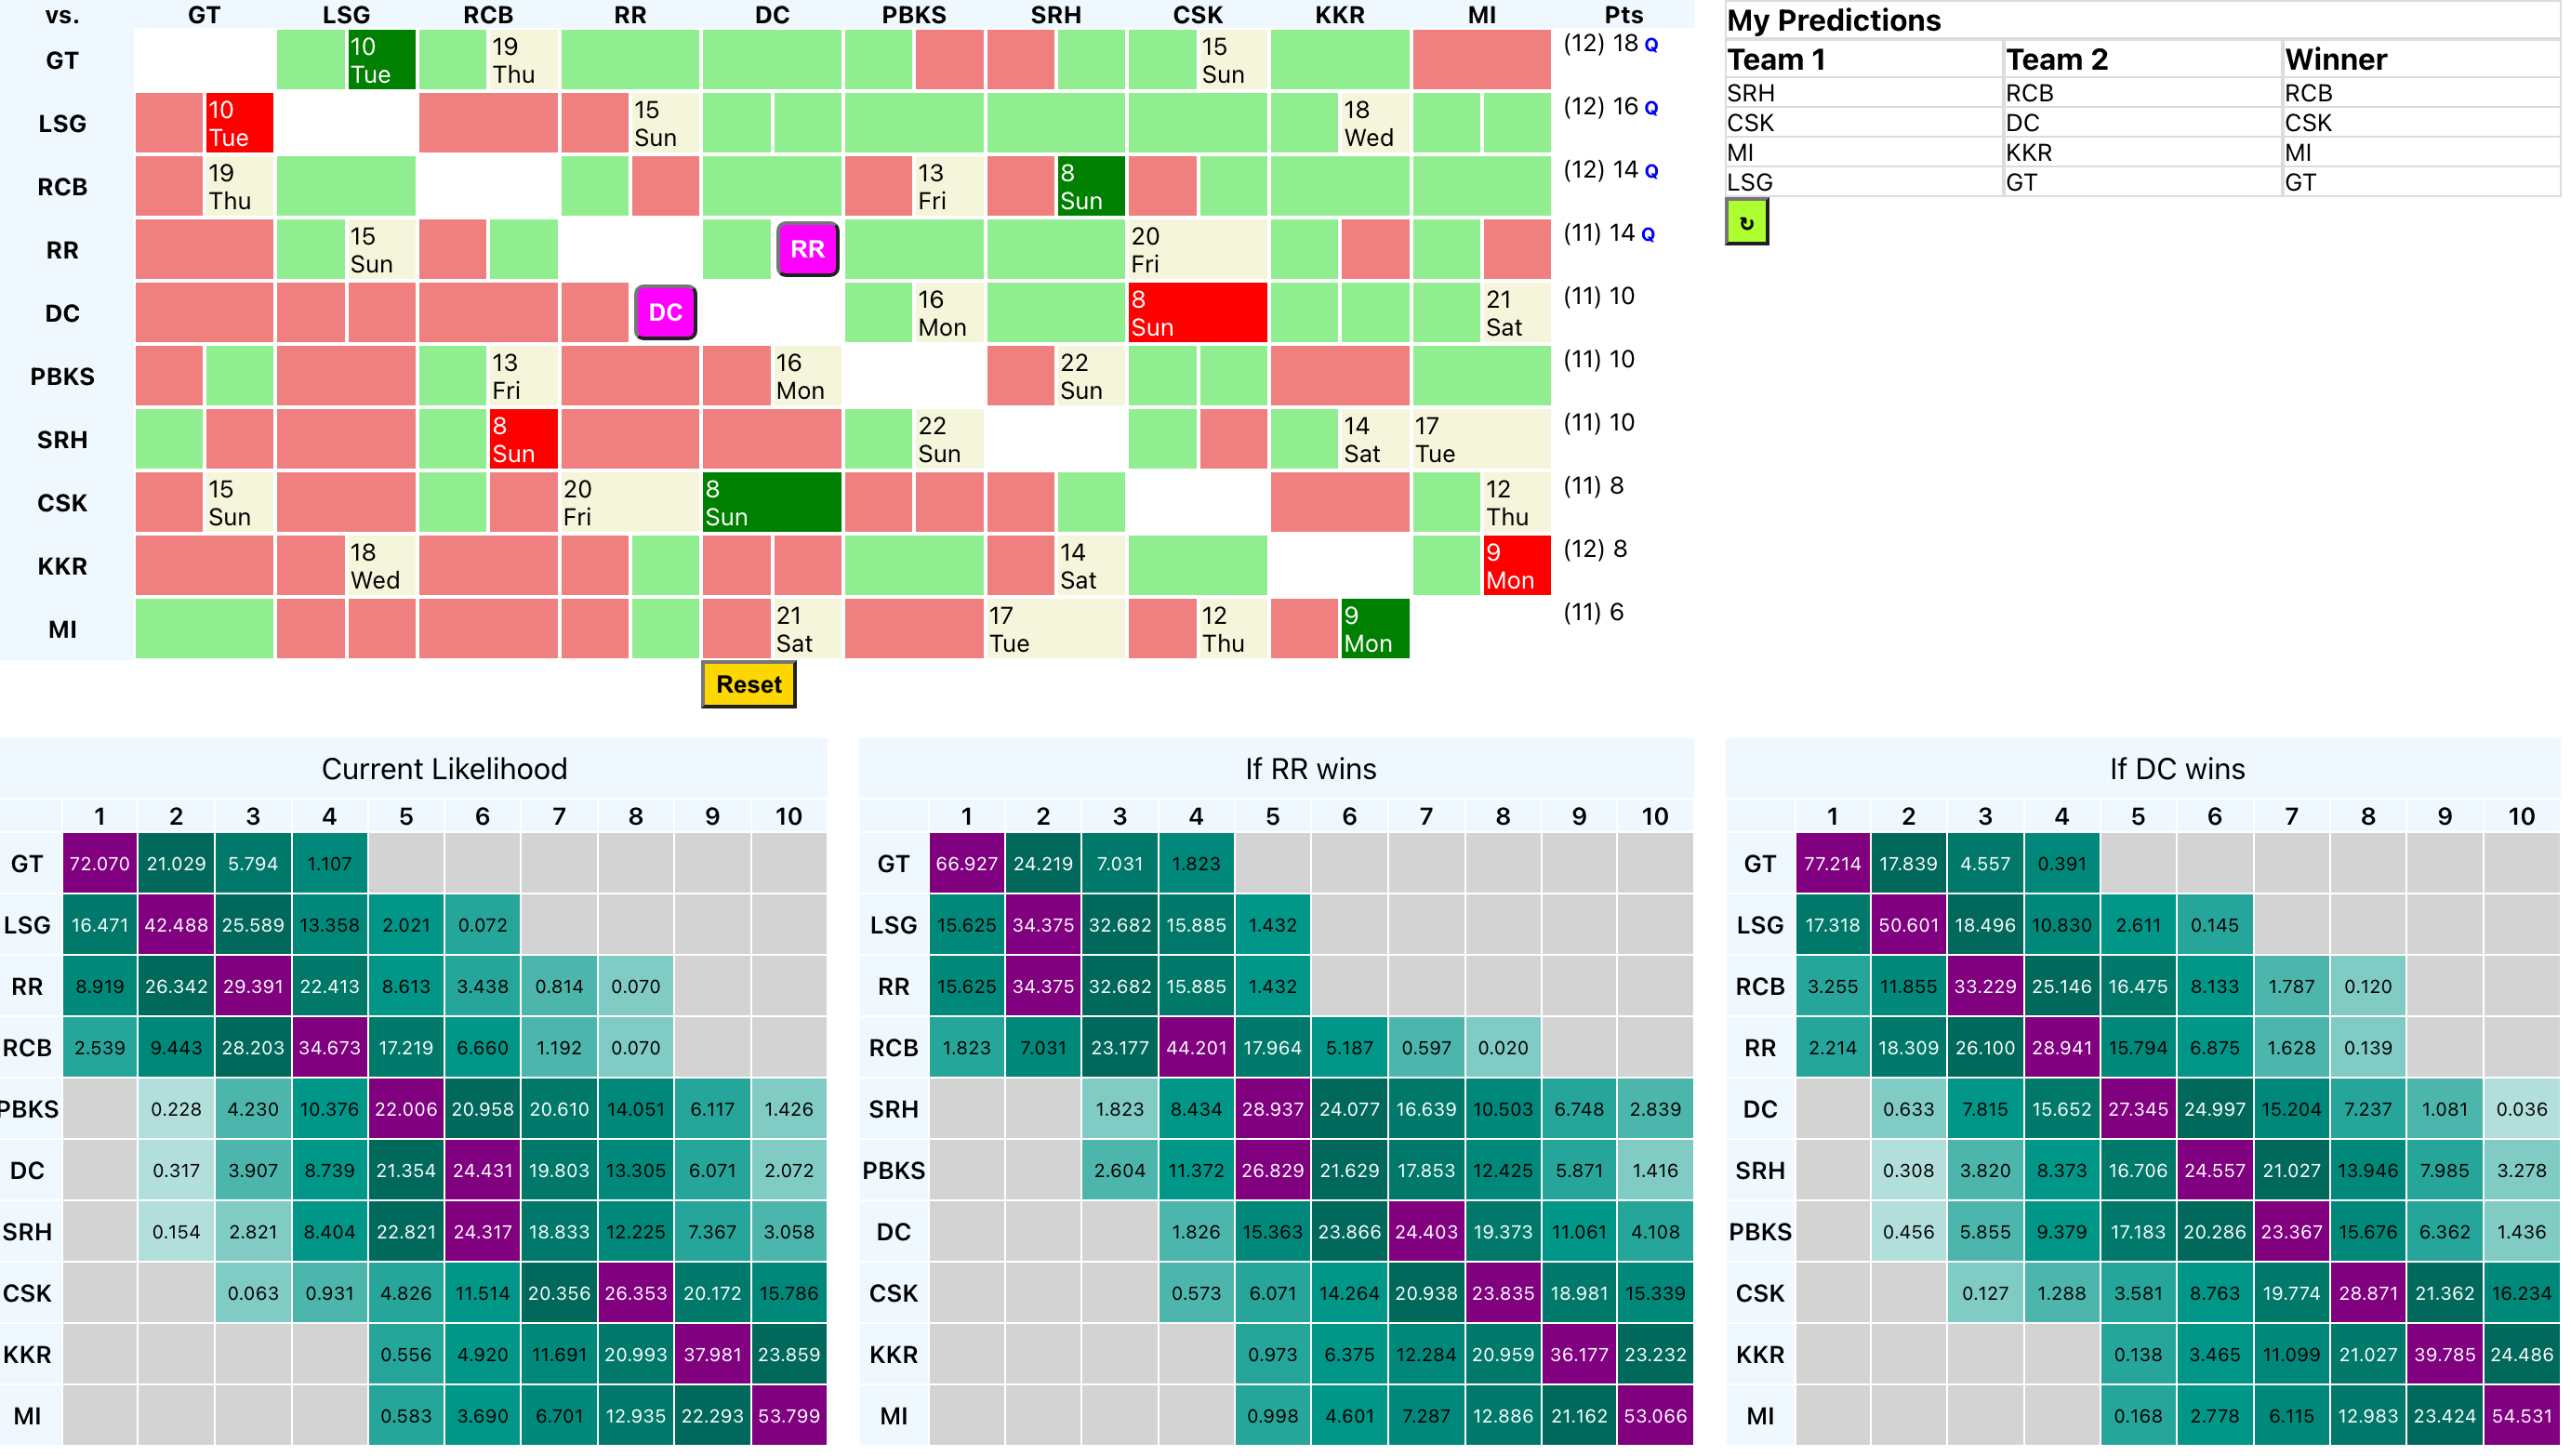
- The top left “Points table” is a 2D matrix of teams head to head. I used a lot of colours here.
- Biege with a date is a match that is planned.
- Pastel Green is a match that is completed and team on the horizontal row won.
- Pastel Red is a match that is completed and the team on the horizontal row lost.
- The clickable Pink button lets you predict a winner for a match in the future.
- Dark Green with a date is a ‘predicted’ result where the team on the horizontal row wins.
- Dark Red with a date is a ‘predicted’ result where the team on the horizontal row loses.
- The Reset button at the bottom clears all predictions.
- There is a points section at the end that is updated on each prediction.
- The top right “My Predictions” keeps track of one’s predictions.
- One can predict only one match at a time in the order it was scheduled.
- There is a rollback button at the bottom to revert one prediction at a time.
- The bottom row is the most useful feature. There are 3 “tables”. All 3 have similar semantics.
- The table gives the probability of a particular team finishing in a particular position.
- The sum of all values in a row will be equal to 100.
- The table is sorted by each team’s “highest probable position in the table”.
- The first table is the current situation, the other 2 tables predicts “what would happen to the probabilities if Team A or Team B wins” respectively.
- It is color coded to highlight the highest probability with a dark purple colour and taper down for each lower probabilities.
- The table gives the probability of a particular team finishing in a particular position.
IPL results simulator
There was a lot to unpack in the UI (it read as a user manual) with lots of colours. I am quite proud of this UI, but I do wonder if this can be simplified in anyway.
The Idea
The design is actually brute force, there is no ML or AI here.
Lets take an example with 3 teams. A, B and C.
The matches are:
- A vs B
- A vs C
- B vs C
There are 8 possible outcomes with these 3 matches:
| Match 1 | Match 2 | Match 3 | A’s win % | B’s win % | C’s win % |
|---|---|---|---|---|---|
| A | A | B | 100 1 |
50 2 |
0 3 |
| A | A | C | 100 1 |
0 3 |
50 2 |
| A | C | B | 50 t |
50 t |
50 t |
| A | C | C | 50 2 |
0 3 |
100 1 |
| B | A | B | 50 2 |
100 1 |
0 3 |
| B | A | C | 50 t |
50 t |
50 t |
| B | C | B | 0 3 |
100 1 |
50 2 |
| B | C | C | 0 3 |
50 2 |
100 1 |
When you average “win %” across all possibilities, it will be 50% for each position in the results table. But in the middle of the tournament this would’ve changed due to previous results - increasing the likelihood of the team that won more matches than the other. By this way we can “predict” the likelihood of which team will end up in which position.
Design
- We will represent a state of past wins as a series of 1s and 0s.
- For example:
0110would mean 4 completed matches. Team 2 won the 2nd & 3rd matches. Lost 1st & 4th.
- For example:
- Let’s maintain the probability state in a 2 x 2 matrix.
- For example, this json means there are 3 teams,
(i, j)represents \({(i + 1)}^{th}\) team’s \({(j + 1)}^{th}\) position’s probability.[[75, 12.5 12.5], [16.67, 66.66, 16.67], [0, 33.33, 66.66]]
- For example, this json means there are 3 teams,
- We will store this in a database with key as match state (e.g.
0110) and value as the probability state. - Everything else is read-only UI.
Implementation
This code provides the core function that calculates and stores results in database. It is a recursive function, where for each match, the function gets recursively called twice.
The complexity of such a function is \(\theta(2^n)\) where \(n\) is the total number of matches to calculate.
/**
 * Recursive function to generate match and positional probability states.
 * matchId: Sequential Integer, represents a match
 * points: Current points table as {team1: points, team2: points, ...}
 * str: match results string. e.g. 01101
 */
function predict(matchId, points, str) {
    // get team1 vs team2 details
    const match = matchResults[`${matchId}`];
    // calculates 2 outcomes. When Team A or Team B wins.
    const outcome1 = { ...points, [`${match.team1}`]: points[match.team1] + 2 };
    const outcome2 = { ...points, [`${match.team2}`]: points[match.team2] + 2 };
    // Exit condition for the recursive function: When we run out of matches.
    if (matchId === END) {
        const s1 = calculateState(outcome1);
        const s2 = calculateState(outcome2);
        writeDB(`${str}0\t${JSON.stringify(s1)}`);
        writeDB(`${str}1\t${JSON.stringify(s2)}`);
        return average(s1, s2);
    }
    // recursively call the function for further outcomes
    const s1 = predict(matchId + 1, outcome1, `${str}0`);
    const s2 = predict(matchId + 1, outcome2, `${str}1`);
    // store intermediate results.
    writeDB(`${str}0\t${JSON.stringify(s1)}`);
    writeDB(`${str}1\t${JSON.stringify(s2)}`);
    return average(s1, s2);
}
Constraint #1: Storage
For 3 matches, the total number of possibilities was \(2^3 = 8\) unique results. But we should also store intermediate results. Which results in
\[2^3 + 2^2 + 2^1 = 14\,records\]This is a mathematical induction equation, where
\[2^1 + 2^2 + 2^3 +\, ...\,+\, 2^k = 2^{k+1} - 2\]In 2022 IPL, there were 70 league matches. So the total number unique results at the start of the tournament is
\[2^{71} - 2 = 2,361,183,241,434,822,606,846\]As you can see, this is a very very large number of records. A Petabyte is \(2^{50}\) bytes. Now, even if we assume 10Kb (\(10 * 2^{10}\) bytes) for each record, we would require
\[\frac{2^{71} * 10 * 2^{10}}{2^{50}} = 10 * 2^{31}\, Petabytes\]Constraint #2: Compute
As explained above, we need to make \(2^{70}\) calculations. Even though it is a one time effort, it is impossible to complete the calculations. Even if we assume that we can calculate 10,000 states in 1 millisecond, the number of years it would take to complete this is close to 14.5 million years:
\[\frac{2^{72}}{1000 * 60 * 60 * 24 * 365 * 10000} = 14,974,525.88\,years\]Mitigation
So it is impossible to calculate position probability for all matches. The usefulness of the data is also not great because, after every match half the data in the database will become useless.
After a few more back of the envelope calculations, it turned out that calculating predictions when 24 or less matches remain out of 70 is doable. This is what I did with the solution.
Setup
- UI: Single Page node.js app hosted on Github pages through
gh-pagesnpm package. - Database: AWS Dynamo DB. AWS provides 25 GB of always free storage in Dynamo DB.
- Backend: HTTP endpoint of a AWS Lambda function with CORS support - returns a record from db.
Mobile Compatibility
Nothing breakthrough here, but very proud of what I did to make this mobile friendly.
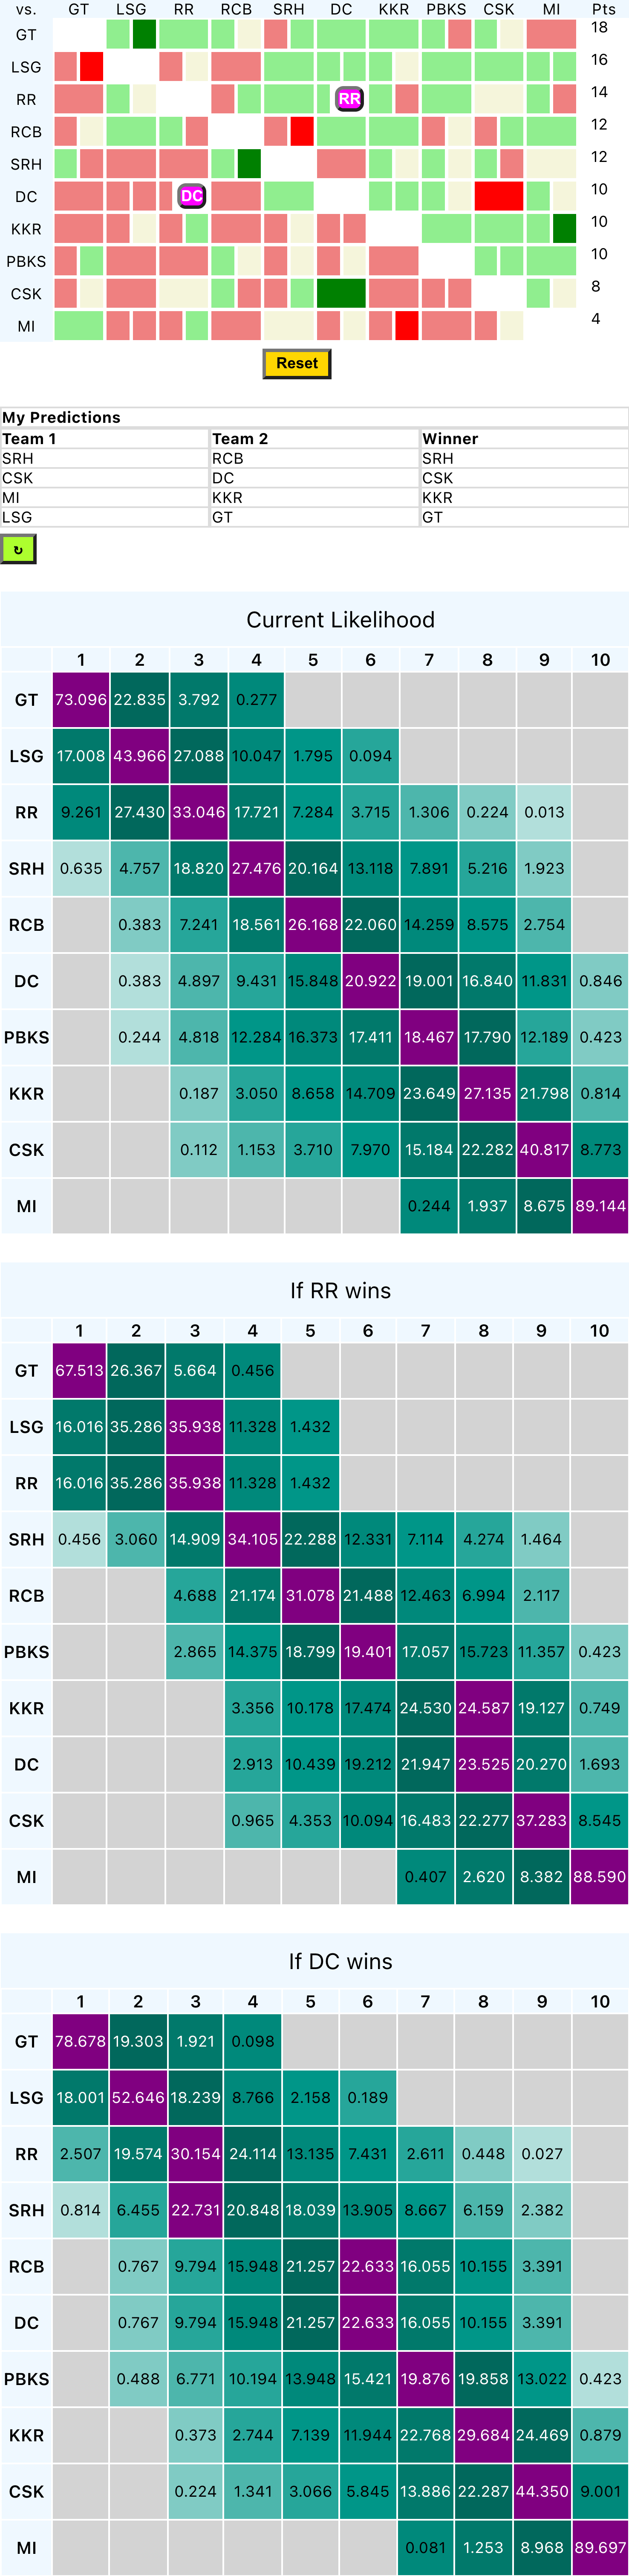
Mobile view